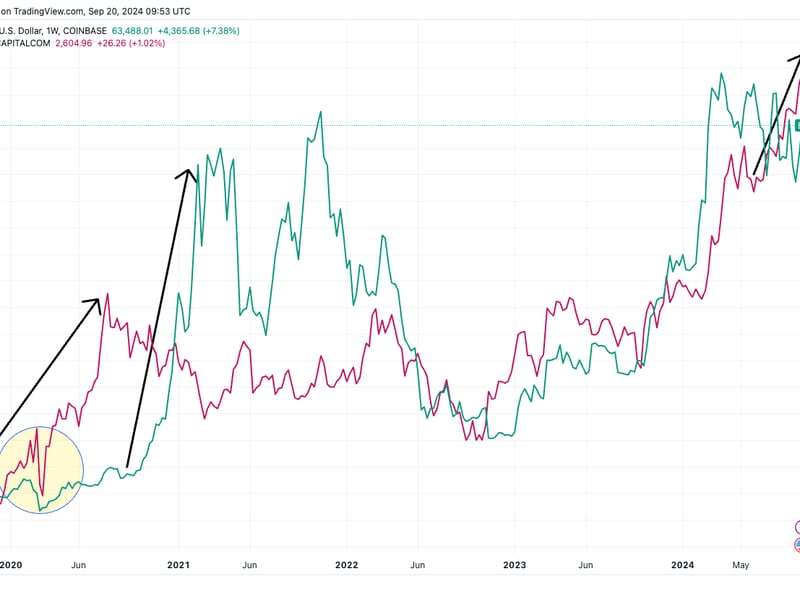
Bitcoin has surged 7% in the past five days, breaking through $64,000 for the first time this month.
Gold has hit all-time highs, surpassing $2,600 an ounce.
These standout performances are linked to increased global liquidity, with expanding global central bank balance sheets and the Federal Reserve’s recent rate cut stimulating investment and economic activity.
In the past five days, bitcoin (BTC) has surged 7%, breaking through $64,000 for the first time since Aug. 26. Gold, for its part, has reached all-time highs on over 30 occasions this year, topping $2,600 an ounce. These remarkable performances mark the first time since bitcoin’s inception in 2009 that both are the top-performing assets of the year, according to Charlie Bilello, the chief market strategist at Creative Planning, an investment management and financial planning firm.
Year-to-date, gold has risen 27%, surpassing its 2020 performance of 25%. The last time it did better was 2007. What is driving this impressive rise?
Gold has historically been seen as a hedge against monetary debasement and global uncertainty, and current economic conditions suggest it is again fulfilling this role. The recent surge in gold prices can be attributed to these factors. Notably, gold began its rally before the significant monetary debasement triggered by the Covid pandemic in 2020, while bitcoin emerged as a star performer in late 2020 and into 2021. With bitcoin now just 14% away from its all-time high, is it playing catch-up once again?
A closer examination reveals that bitcoin’s price tends to move in line with the Federal Reserve’s net liquidity metric. This measure, calculated by subtracting reverse repo and the Treasury General Account from the Fed’s balance sheet, indicates that bitcoin tends to follow liquidity trends.
Both bitcoin and net liquidity bottomed out toward the end of 2022, coinciding with the FTX collapse. Since then, bitcoin has steadily risen alongside an increase in net liquidity, which now exceeds $6 trillion.
The Federal Reserve’s balance sheet is currently at $7.1 trillion, and although it is still engaging in quantitative tightening, the pace has slowed. The collapse of Silicon Valley Bank (SVB) in March 2023 led to a $1.6 trillion reduction in the balance sheet, bringing it back to levels seen during the initial phases of quantitative easing in response to the pandemic.
The draining of reverse repo balances, now just over $300 billion, releases liquidity back into the financial system. This is stimulative, increasing the availability of funds for lending, investment, and overall economic activity.
Looking more broadly, the combined balance sheets of the world’s 15 largest central banks – including the U.S., European Union, Japan and China – approach $31 trillion.
While this number alone is not the focus, the trend shows a global resurgence in central bank balance sheets from about $30 trillion in July. This increase in liquidity is particularly stimulative for bitcoin, which tends to mirror liquidity trends.
Adding to this, just Wednesday the Fed cut the interest rate by 50 basis points, further supporting the rise of bitcoin and gold.


