

Bitcoin Price Restarts Rally, Why BTC Could Soon Hit $65K
Bitcoin price is gaining momentum above the $62,000 resistance. BTC is signaling an upside break and might surge toward the $65,000 resistance. Bitcoin price is moving higher from the $61,200 support zone. The price is trading above $62,500 and the 100 hourly Simple moving average. There was a break above a key bearish trend line with resistance at $62,300 on the hourly chart of the BTC/USD pair (data feed from Kraken). The pair could accelerate higher toward the $65,000 resistance or even $65,730. Bitcoin Price Regains Strength Bitcoin price remained well-bid above the $60,000 support zone. A base was formed, and the price started a fresh increase above the $62,000 resistance. There was a break above a key bearish trend line with resistance at $62,300 on the hourly chart of the BTC/USD pair. The pair even cleared the 76.4% Fib retracement level of the downward move from the $63,583 swing high to the $60,108 low. Bitcoin is now trading above $62,500 and the 100 hourly Simple moving average. Immediate resistance is near the $63,800 level. The next key resistance could be $64,500, above which the price could rise toward the $65,000 resistance zone. Source: BTCUSD on TradingView.com If the bulls remain in action, the price could even surpass $65,000 and test $65,500. Any more gains might send the price toward the 1.618 Fib extension level of the downward move from the $63,583 swing high to the $60,108 low at $65,730. Are Dips Supported In BTC? If Bitcoin fails to rise above the $64,000 resistance zone, it could start another downside correction. Immediate support on the downside is near the $62,750 level. The first major support is $62,250 or the 100 hourly SMA. If there is a close below $62,250, the price could start a decent pullback toward the $61,000 zone. Any more losses might send the price toward the $60,000 support zone. Technical indicators: Hourly MACD – The MACD is now gaining pace in the bullish zone. Hourly RSI (Relative Strength Index) – The RSI for BTC/USD is now above the 50 level. Major Support Levels – $62,750, followed by $62,250. Major Resistance Levels – $63,800, $65,000, and $65,730.
Bitcoin price is gaining momentum above the $62,000 resistance. BTC is signaling an upside break and might surge toward the $65,000 resistance.
Bitcoin price is moving higher from the $61,200 support zone.
The price is trading above $62,500 and the 100 hourly Simple moving average.
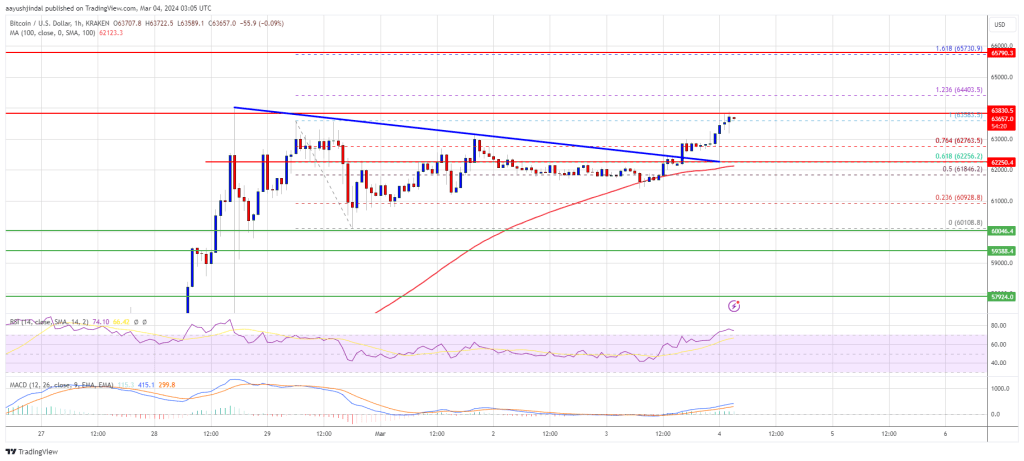
There was a break above a key bearish trend line with resistance at $62,300 on the hourly chart of the BTC/USD pair (data feed from Kraken).
The pair could accelerate higher toward the $65,000 resistance or even $65,730.
Bitcoin Price Regains Strength
Bitcoin price remained well-bid above the $60,000 support zone. A base was formed, and the price started a fresh increase above the $62,000 resistance.
There was a break above a key bearish trend line with resistance at $62,300 on the hourly chart of the BTC/USD pair. The pair even cleared the 76.4% Fib retracement level of the downward move from the $63,583 swing high to the $60,108 low.
Bitcoin is now trading above $62,500 and the 100 hourly Simple moving average. Immediate resistance is near the $63,800 level. The next key resistance could be $64,500, above which the price could rise toward the $65,000 resistance zone.
Source: BTCUSD on TradingView.com
If the bulls remain in action, the price could even surpass $65,000 and test $65,500. Any more gains might send the price toward the 1.618 Fib extension level of the downward move from the $63,583 swing high to the $60,108 low at $65,730.
Are Dips Supported In BTC?
If Bitcoin fails to rise above the $64,000 resistance zone, it could start another downside correction. Immediate support on the downside is near the $62,750 level.
The first major support is $62,250 or the 100 hourly SMA. If there is a close below $62,250, the price could start a decent pullback toward the $61,000 zone. Any more losses might send the price toward the $60,000 support zone.
Technical indicators:
Hourly MACD – The MACD is now gaining pace in the bullish zone.
Hourly RSI (Relative Strength Index) – The RSI for BTC/USD is now above the 50 level.
Major Support Levels – $62,750, followed by $62,250.
Major Resistance Levels – $63,800, $65,000, and $65,730.


